Got a question around your new water tariff? Get the information you need here.

×

Total CO2e emitted in 2025
755 tonnes

Everflow is a fast-growing, increasingly efficient multi-utility retail business. We increased our revenue by 37% (£69 million[1]) in 2025 and increased our profitability by 44% (£2.2m EBITDA-R), while increasing our average FTE employees by 21% (41 FTEs) and customers by 9% (from 110,411 to 120,870).

Our absolute carbon emissions sometimes increase because we are growing the business. Therefore, the best way to understand whether our carbon reduction efforts are working is by monitoring intensity metrics, as below.

For example,

  • We reduced our Scope 1 and 2 emissions per m2 of office space by two thirds.
  • Our emissions per employee decreased by 74%.
  • We significantly reduced our total Scope 1, 2 and 3 emissions per £million in sales revenue and per £million of profit.

This year, we ended our old head office contract, grew our customer base across three utility services, and increased our headcount.

[1] Correct as of 31 March 2025

GHG emissions Reporting

Emissions per Tonnes CO2e 2022 Tonnes CO2e 2023 Tonnes CO2e 2024 Tonnes CO2e 2025 Change
FTE employee* 0.26 0.38 0.47 0.12 -74%
m² office space occupied (902/1,030/1,542)* 0.044 0.064 0.059 0.018 -8%
£m sales revenue 12.89 7.195 3.35 2.96 -53%
£m EBITDA 4,219 1,482 124 105 -92%

*Excludes Scope 3 emissions

We are committed to the Climate Pledge to reduce our absolute emissions by at least 90% before 2040, and offset our remaining emissions (Net Zero) – all while growing our business.

This is our fifth year of reporting GHG emissions figures, but our base year was redefined to 2022, so we compare them with 2022 and our target trajectory towards Net Zero by 2040.

We already offset all our emissions because we understand the need to do this while we are reducing them. The Oxford Principles for Net Zero Aligned Carbon Offsetting include engaging suppliers now to build capacity for offsetting in time for Net Zero.

We have not included emissions from purchased wholesale water, wastewater or waste collection services on behalf of our customers in our Scope 3 emissions (which were 19,584 tonnes[1] for 2025) because we know these to be on a Net Zero journey of their own, which we don’t have a strong influence over. We offer services to help our customers reduce their water consumption too. We have included all other professional services purchased. These have increased significantly from 9,731 tonnes in 2021, due to our continued growth in customers (currently more than 120,000 vs 110,000 in 2024)

However, all our emissions (excluding those from water wholesalers and waste wholesalers omitted) have been offset from 2021-25 through the purchase of carbon credits. The UK government reported that water supply emission estimates increased by 25% in 2025[2]. In addition, many emissions factors for UK waste disposal reduced by 27% in 2025.

[1] MOSL 2025 settlement dashboard report, volumetric usage based, latest available excluding extreme outliers run 21 Jan 2026

[2] Major changes to the Conversion Factors 2025 latest water supply figures show 25% increase in CO2e from previous year.

Emissions by scope

Scope 1

Direct emissions from sources owned or controlled by Everflow:

  • Stationary combustion equipment, e.g., boilers, used for building heating
  • Refrigerants used for cooling buildings.

Scope 2

Indirect emissions from purchased sources of energy that the company does not control, e.g., electricity.

Scope 3

All other indirect emissions from Everflow’s activities but from sources controlled by external organisations, e.g., mobile combustion from travel, outsourced services and purchased products, employee home working.

Total carbon emissions targets

Scope 1 and 2 carbon emissions targets

Our Scope 1 and 2 emissions have decreased and are now lower than our 2025 target (27 tonnes vs 33 target). However, no longer having any leases at our old Wynyard offices from 2026 will help reduce Scope 1 and our transfer to a 90%+ renewable electricity contract for our Peterlee HQ in July 2025 has already halved our Scope 2 emissions and will reduce these even further in 2026.

While we would prefer to generate and export energy to the grid from renewable sources like solar and wind to reduce our Scope 2 emissions further, our landlord is not currently willing to allow us to install these systems.

Scope 3 carbon emissions targets

Our scope 3 emissions targets require the steepest reduction in absolute terms.

Our Scope 3 emissions have also reduced 479 tonnes further than their target (728 tonnes vs 1,207 target).

Our total emissions are therefore better than their target by 485 tonnes (755 tonnes vs 1,240 target).

Workspace emissions

This has resulted in our Scope 1 emissions halving in 2025 – despite retaining the lease on a previous building and our headcount increasing by 21%.

Top ups of refrigerant in our offices which used air conditioning were responsible for 91% of our Scope 1 emissions in 2022. Happily, following pressure from us on our landlords and a move to a new HQ, none were reported to us in 2023-25[1].

[1] We have requested proof in the forms of F-Gas Registers and maintenance records from our landlords, but as we have not yet had receipt of this, there is a risk that our Scope 1 may be higher than reported.

Our new HQ is entirely heated and cooled by electricity and we retained our old HQ lease in 2025, but we transitioned to 90% renewable electricity at our new HQ, and reduced our energy use across all sites, which reduced our Scope 2 emissions by two thirds to 23.52 tonnes CO2e using the market-based method.

We used a third less electricity in 2025 than the previous year. Our Peterlee office achieved a 30% reduction and our Nuneaton office a 10% reduction. Most of the energy use in Nuneaton is from shared areas which our landlord controls.

Scope 3 emissions

Our largest contributor to our carbon footprint, as for many businesses, is associated with our supply chain.

We outsource a substantial amount of our operations. Therefore, influencing our supply chain is very important because more than half of our Scope 3 emissions are from purchased goods and services.

We have not included the waste services delivered to our customers in our Scope 3 reporting because we cannot control the amount of waste we collect, but these totalled 79 tonnes CO2e in 2025. We benchmark our waste suppliers against quality criteria, including sustainability. As we grow our Waste operations, we are working with the most sustainable suppliers.

However, how we travel (commuting and for business) also has a large impact and is more within our control. Commuting emissions have decreased slightly from 148 to 140 tonnes, despite our growth. More employees walk to work, use public transport, drive electric vehicles or car share. 78% of employees now live within 15 miles of their office.

Working from home emissions have almost doubled from 35[1] to 65 tonnes, partly due to more employees working from home at least 3 days a week than last year (54% vs 44%).

[1] This year, we used the EcoAct Homeworking Emissions whitepaper 2020 figure of 67.7% for additional heat calculations from WFH. This is because they found that 33.3% of employees working from home already have someone else in the house requiring heating. We have therefore back-calculated the 2024 figure using the same method, to ensure comparability.

Further analysis

Purchased goods and services

Emissions from this category almost doubled from 281 to 487 tonnes in 2025. Most of our Scope 3 emissions are categorised as “Other professional services”.

We categorised all those we had more oversight of below.

Waste

In 2025 we continued to expand our commercial waste collections department and collected 8,351 (up from 5,340 tonnes last year) of waste, generating 79 (up from 39) tonnes CO2e of emissions[1]. In 2023, we used the spend based method to calculate waste emissions, which is based on national averages of types of waste collected from households and businesses and how these streams are processed.

But in 2024, we began monitoring how much of the waste we collect is recycled or composted/digested (food and garden type waste). We also set ambitious targets for 2025-30 to drive waste processing emissions down and provide more recycled content to manufacturers so they don’t need to mine as many virgin materials.

Collection type 2023% volume collected 2024 weight collected 2025 weight collected
Dry Mixed Recycling 23% 11% 11%
Glass recycling 0% 16% 13%
Food Waste 2% 9% 11%
Residual (general) waste 76% 62% 63%
Fate 2023 2024 2025 2030 target
Recycled or composted/digested 28% 27% 28% 75%
Energy from Waste 71% 72% 71% <50%
Incinerated (without energy/heat capture) 2% 0.8% 1% 0%
Landfill 0.2% 0.2% 0.2% Close to 0%

We already benchmark our suppliers against various criteria including recycling rates and social sustainability. In 2025, we requested individual carbon footprints associated with our customers’ waste services from our suppliers and encourage them to reduce these in line with Net Zero. There is still more to do to help suppliers calculate and report this data.


For landfill, collection, transportation and landfill emissions (‘gate to grave’) are included. For combustion and recycling, GHG Protocol conversion factors consider transport to an energy recovery or materials reclamation facility only, with subsequent emissions attributed to electricity generation or recycled material production respectively. Emissions from energy recovery, recycling, composting and anaerobic digestion are attributed to the user of the recycled materials, not the producer of the waste, in line with GHG Protocol Guidelines.


Telephone and broadband services

In 2024 we launched our Telecoms directorate. Our partner in this field has an AA ESG rating from MSCI.

Technology

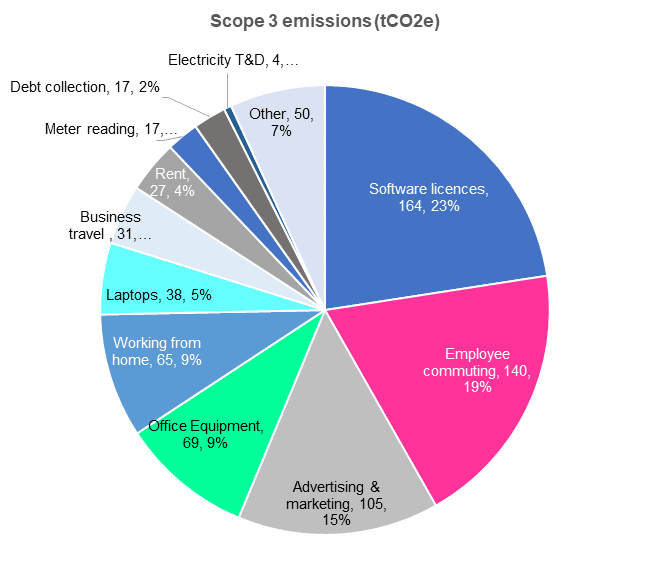
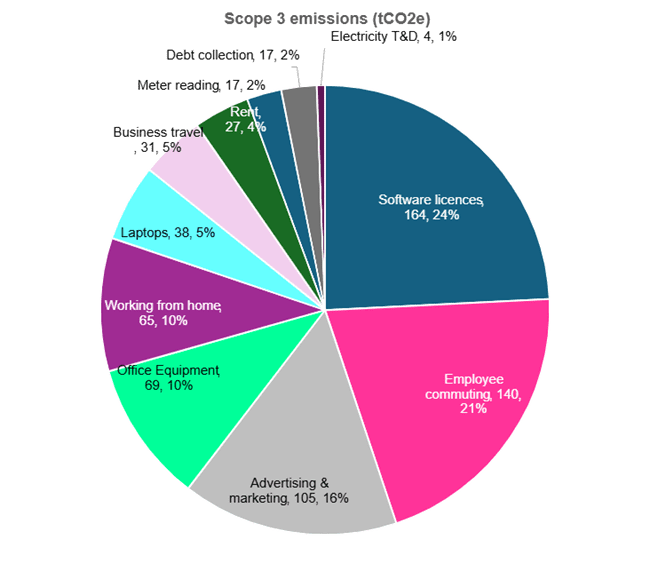
How we purchase and reuse laptops still has the largest impact on emissions from purchased goods and services (representing almost a third of these). It is also one of the categories most in our control. We included actions to reduce the emissions and waste associated with our use of technology (software, data and hardware) in our 2030 Sustainability Strategy.

Our emissions from software subscriptions have decreased because many software suppliers are sourcing zero carbon electricity and offsetting using high quality carbon credits, so were rated 0.00 in the ONS spend based emissions factors in 2025.
We are awaiting a business rate re-valuation for Rateable Value following refurbishment of our HQ at Peterlee.
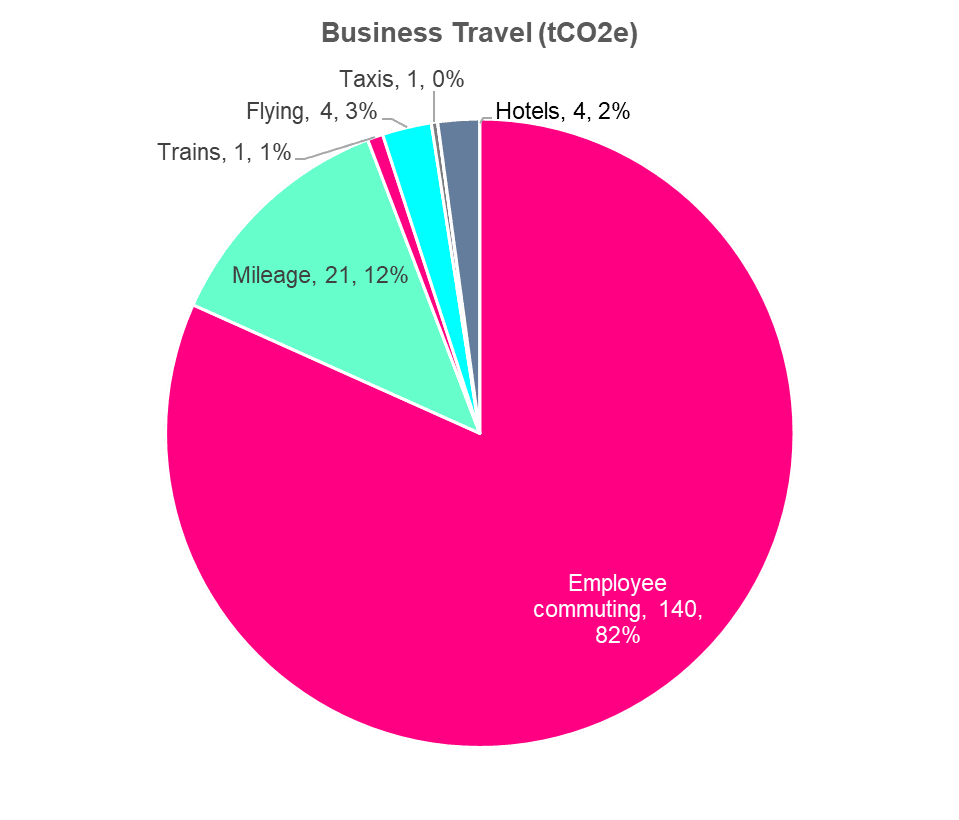
Business travel reduced slightly this year and employees car share when possible.

For laptops, instead of using the spend based method using UK government figures, which rates even the manufacture of laptops to be low carbon (perhaps due to zero carbon electricity and transport or offsetting), we report a figure associated with the whole life cycle of laptops. In 2025 we bought 113 laptops, and the average footprint of a laptop is calculated by Circular Computing to be 335kg . This results in a laptop footprint of 38 tonnes in 2025 (vs 44 last year).
For waste, we no longer include emissions associated with our supply chain (disposal) as well as collection, because it is mostly treated and disposed of via recycling and incineration for energy. Emissions associated with these methods are assigned to the recycled products manufactured and the energy produced, in line with the GHG Protocol. The UK government also reduced spend based factors for many disposal methods by 27% this year.

For suppliers that have not yet reported their actual emissions to us, we have had to use the spend-based method, which is based on average emissions per £1 spend for each industry SIC code of the product/service purchased.
The spend-based method results in SIC codes potentially being assigned incorrectly to suppliers and fails to reflect the impact of choosing more sustainable suppliers or asking our suppliers to measure their footprint and reduce it. Therefore, we will request carbon emissions information from our suppliers annually and provide support with calculating them.

However, as we report by calendar year and many other companies report by financial year, this would move our reporting to the end of each year and would not enable us to report our SECR with our annual accounts in Q2.


Scope 3 emissions (tCO2e)

Electricity and heating

We have a hybrid working policy which allows employees to work from home up to three days per week. As well as calculating the carbon footprint of our office spaces, we have therefore included emissions associated with home working in our Scope 3 emissions.

The proportion of our emissions from electricity and heating from home working has doubled because home working days have doubled. More is used on office electricity than on office gas and coolants, because our new HQ has no gas and we didn’t need any refrigerant top-ups in 2025.

Unfortunately, increased home working does not directly translate into decreased heating and power bills at our offices. Many companies have not considered the increased emissions associated with employees working from home. However, we’ve calculated that these are, on average, offset by the associated decrease in employee commuting.

We carried out a detailed employee survey from mid-December 2025 to mid-January 2026 to understand how often employees worked from home. We issue advice to help employees reduce their energy bills when working from home every winter, which at least half of employees reported taking up in 2025.

In 2024, 24% of our employees worked from home less than 3 days per week. This year, 40% did, which will have increased potential emissions from employee commuting.

Travel

Most of our emissions associated with travel were from employee commuting (82% – 140 tonnes CO2e from more than 605,000 miles). This has decreased slightly since last year, and reduced per employee, given the significant increase in home working and our growth from 192 to 233 FTE.

Our December 25-January 2026 employee survey was mandatory. We also used previous surveys to estimate commuting by employees who left during 2025.

  • 75% of employees travelled to work by fossil fuelled cars, which has decreased slightly from 79% in 2024. 10% of employees used EVs or hybrids and 17% used public or zero emission modes of transport.Employees who commuted by car share decreased to 9% of car commuters.
  • The mean distance travelled to work has halved from 17 to 8 miles, and the proportion travelling less than 20 miles to get to work increased from 61% to 75%.
  • 19% of employees commuted by car to work 5 days a week in 2025 (no change), and 40% commuted by car 2 or 3 days a week (down from 68% last year).
  • While 76% were still driving in alone, slightly more (6%) used public transport and triple the proportion (15%) walked. 3% were based remotely.
  • 17 employees mainly came by fully electric car (increase of 5) and 9 by hybrid (increase of 2). 20 employees (decrease from 30) were car sharing (7%).

During 2022, we launched a salary sacrifice Electric Vehicle leasing scheme for our employees. 28 current employees have switched away from fossil fueled cars. We also coordinate a car share matching scheme for employees every six months.

In 2022, we also launched a hybrid working policy which allowed most employees to work from home 2-3 days a week. We calculate that every additional day per week that employees work from home should save an average of 5 tonnes of CO2e from commuting, and add 4.5 tonnes of CO2e from additional heating and electricity use in the home, so a net half a tonne saving.

Regarding business travel, we introduced a travel and accommodation booking platform in 2025 called TravelPerk (now Perk) to ensure all travel is booked in line with policy and our new Expenses software now requires employees to give more details of their spending. In 2025, our employees drove more than 68,000 (increasing slightly from 66,743) business miles, generating 21 tonnes CO2e at a cost of £25,000 to the business. Hotel stays generated 4 tonnes CO2e and taxis 0.5 tonnes.

Most of the flights booked by the company (4 tonnes) are associated with one remote working Director who travels monthly to spend a week in the office, and their emissions are offset by the airline as standard.

Our latest survey found that two thirds of employees worked from home at least two days per week in 2025 (down from three quarters in 2024).

But new employees mostly living closer to our new HQ and car sharing or walking to work are why our commuting emissions have modestly (5%) decreased despite a greater headcount, and we expect this to continue as more employees switch to EVs.

Emission reduction activities in 2025

Supplier engagement

93 suppliers audited against new ESG criteria.

20% of top 40 suppliers by spend confirmed on Net Zero journey.

Buildings energy, water & carbon

Transitioned to 90% renewable electricity at Peterlee HQ.

20% electricity for Nuneaton office from solar panels on roof and remainder from UK average emissions electricity supplier.

No fugitive emissions from escapes of refrigerant gases at both sites.

Technology

Trialled a water logger to identify usage spikes and potential leaks but did not work at our HQ so we will replace it with a different system in 2026.

Accessed sub meter reads for café and gym to understand HQ energy use better.

Reducing consumption and waste

More than 90% of HQ office waste was recycled from April to December 2025.
29% of customers’ waste recycled or composted, but 75% target for 2030.

Universal employee sustainability training delivered to 85% of employees and e-learning modules added to intranet for new starters and refreshers.

Completed water-saving works at head office – estimated to save 0.3tonnes CO2e and 300m3 water per year.

Employee travel and home working

Company-wide hybrid working policy enables employees to work at least 2 days a week from home widely taken up.

Annual mandatory employee survey on commuting and home working to identify ways to reduce related emissions achieved 97% completion.

Fuel and energy saving advice for employees on home working (annual).

EV salary sacrifice scheme increased use.

Car sharing matching scheme run every 6 months.

Emissions reduction initiatives planned for 2026

Initiative
1. Get Net Zero by 2040 and other ESG commitments from top 40% by spend suppliers.
2. Increase the suppliers we get Scope 3 emissions from to top 50% of spend, to reduce use of spend and SIC-Code based averages for our carbon footprint.
3. Influence Nuneaton landlord to transition to 100% renewable electricity contract.
4. Support contract managers and procurement champions to promote sustainability to suppliers and assist with data collection.
5. Influence Nuneaton landlord to change refuse contracts to enable greater monitoring and segregation of waste streams to reduce proportion of waste burnt or buried.
6. Investigate environmental and social sustainability of our Artificial Intelligence Strategy and improve it.
7. Investigate sustainability of the data centres we use.
8. Improve sustainability of our workwear, e.g. by using removable logos and more natural materials.

METHODOLOGY

Produced in accordance with the GHG Reporting Protocol – Corporate Standard method

For the period 01/01/2025 to 31/12/2025.

Data collected from primary information sources, including direct building manager interviews, employee surveys, employee FTE lists and official documents (bills, invoices and purchase ledger).

  • Excludes emissions from purchased wholesale water and wastewater services on behalf of our customers (but we still offset these).
  • Average waste disposal assumed for number of employees, sector and size of buildings in Nuneaton office.
  • Emissions associated with procurement and services, including business travel without recorded mileage, and hotels, are mostly based on expenditure and assigned SIC codes.
  • Emissions associated with employee commuting based on distance by vehicle fuel type and size (small/medium/large).
  • Employee commuting and home working includes leavers.
  • Included optional emissions associated with working from home, including electricity T&E.
  • Modelled using DEFRA Emission Factors 2025 and Atmospheric emissions: greenhouse gas emissions intensity by industry (ONS, 2025)

All our emissions (excluding customer water use-based emissions from 2024 onwards) were offset from 2021-25 through purchase of carbon credits.

Full-time equivalent (FTE) staff = 233

Square meters of office occupied = 1,542

2022 update

Emissions Footprint Report 2022

2023 update

Emissions Footprint Report 2023

2024 update

Emissions Footprint Report 2024

Thank you for reading!

If you have any questions or comments about this report or our strategy, please use our contact form via the link below.